Organizing notes and information is a challenge. Traditional methods like folders and tagging fall short because they require continuous manual effort to keep organized. What if we could leverage recent advances in machine learning to organize these notes automatically?
Along with AI advancements, we have modern computing capable of rendering rich 3D environments. Yet, most user interfaces are still confined to a 2D plane.
This post is an experiment that leverages machine learning text embeddings to organize information in a 3D space within your browser.
Go here to try the demo in your browser
Inspiration
A few notetaking apps like Logseq, Obsidian, and Roam have a “graph view,” which displays your notes on a 2D canvas so that you can explore connections between ideas at a high level.
Here’s a screenshot of my graph view in Logseq
This type of graph is called a “force-directed layout.” When I create a link between pages, a line connects those pages. If I want to find topics related to “machine learning”, I can see which pages are connected.
This view is useful, but I wanted to extend it with two ideas:
First, Is there a way to automatically generate a view like this without manually linking pages? How can we use machine learning to discover these relationships and groups automatically?
Second, Can we display the nodes in 3D to provide more insight into the relationships and make exploring large graphs with many nodes easier?
Another similar project is the tensorflow embeddings projector
This visualization uses machine learning to plot the relationships of individual words in 3D space. This is very close to what I want for my notes, but can we make it work for entire documents, instead of just individual words?
Intro to text embeddings
Text embeddings are lists of numbers generated by machine learning models that represent the “meaning” of a short piece of text. You can generate text embeddings for multiple pieces of text and calculate their “similarity” to each other.
The text embedding models were trained on a large body of text, which allows them to understand the context and relationships between words and phrases. This enables them to differentiate between words with multiple meanings, identify synonyms, and understand nuances.
For example, text embeddings could understand that the words “King” and “Queen” are similar, whereas “King” and “Dog” are not similar.
This technique has two popular uses: search and clustering.
In search, text embeddings help you find the page you search for, even when your search query doesn’t directly match the content. For example, if I searched “award-winning fantasy movies,” I would find “Lord of the Rings” and “Harry Potter,” even though these results don’t contain the search keywords like “movie” or “fantasy.”
The other main application is grouping related text, which is the focus of this post.
Text embeddings and UMAP
After turning text into embeddings, you can use an algorithm called UMAP to arrange the articles in either 2D or 3D space. We give the algorithm a list of embeddings, and it returns 2D or 3D coordinate points for each embedding.
In the visual representation, similar texts are grouped closely together.
The Dataset
The experiment features two datasets: Wikipedia’s 1000 “Level 3 Vital Articles” and 10,000 “Level 4 Vital Articles.”
These lists are articles that Wikipedia thinks are most essential. Wikipedia editors manually organize them into history, people, geography, and science categories.
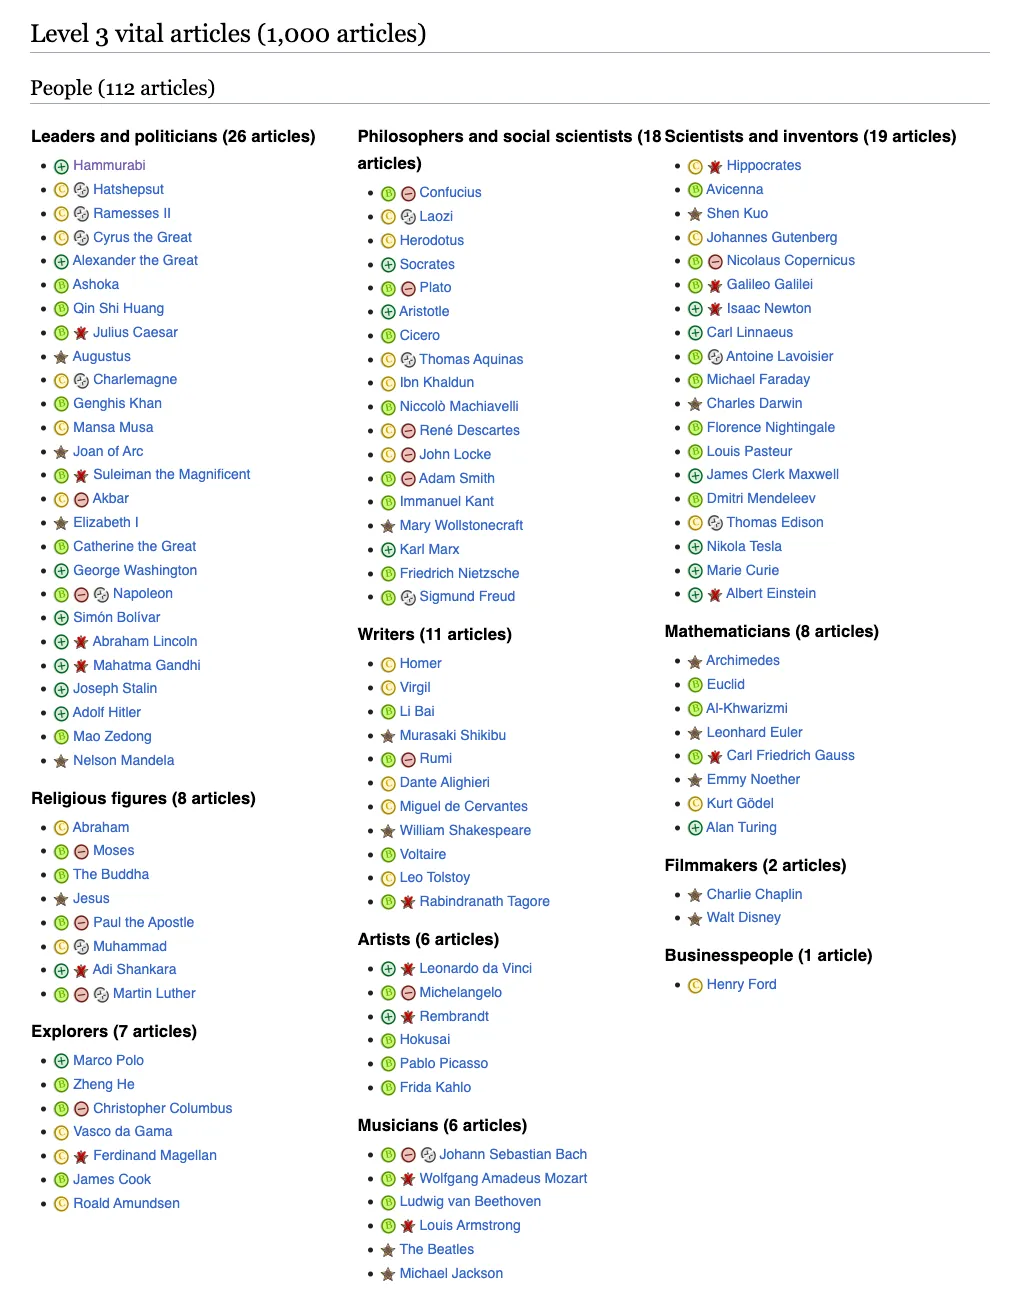
The demo has examples for the 1k and 10k sets of articles. Selecting the 10K option needs a reasonably powerful computer.
When generating the embeddings for each Wikipedia article, I break each Wikipedia page into 500-word chunks and average the embeddings for each page to calculate the “average meaning” of the page.
This same technique could be used for any document, such as notes or web pages, but Wikipedia is an interesting dataset for the demo.
The Result
As expected, the text embeddings naturally cluster the Wikipedia articles into similar groups, mimicking their manual categorizations. In these visualizations, I display the title of the Wikipedia page and position it based on the “meaning” of the text on that page.
2D Space
Let’s start by visualizing the articles in 2D space.
UMAP generates a graph of points in 2D space based on the embeddings, and we can see clusters of similar articles forming.
It’s hard to read the text in the clusters, but I didn’t spend much time optimizing the spacing for the 2D view.
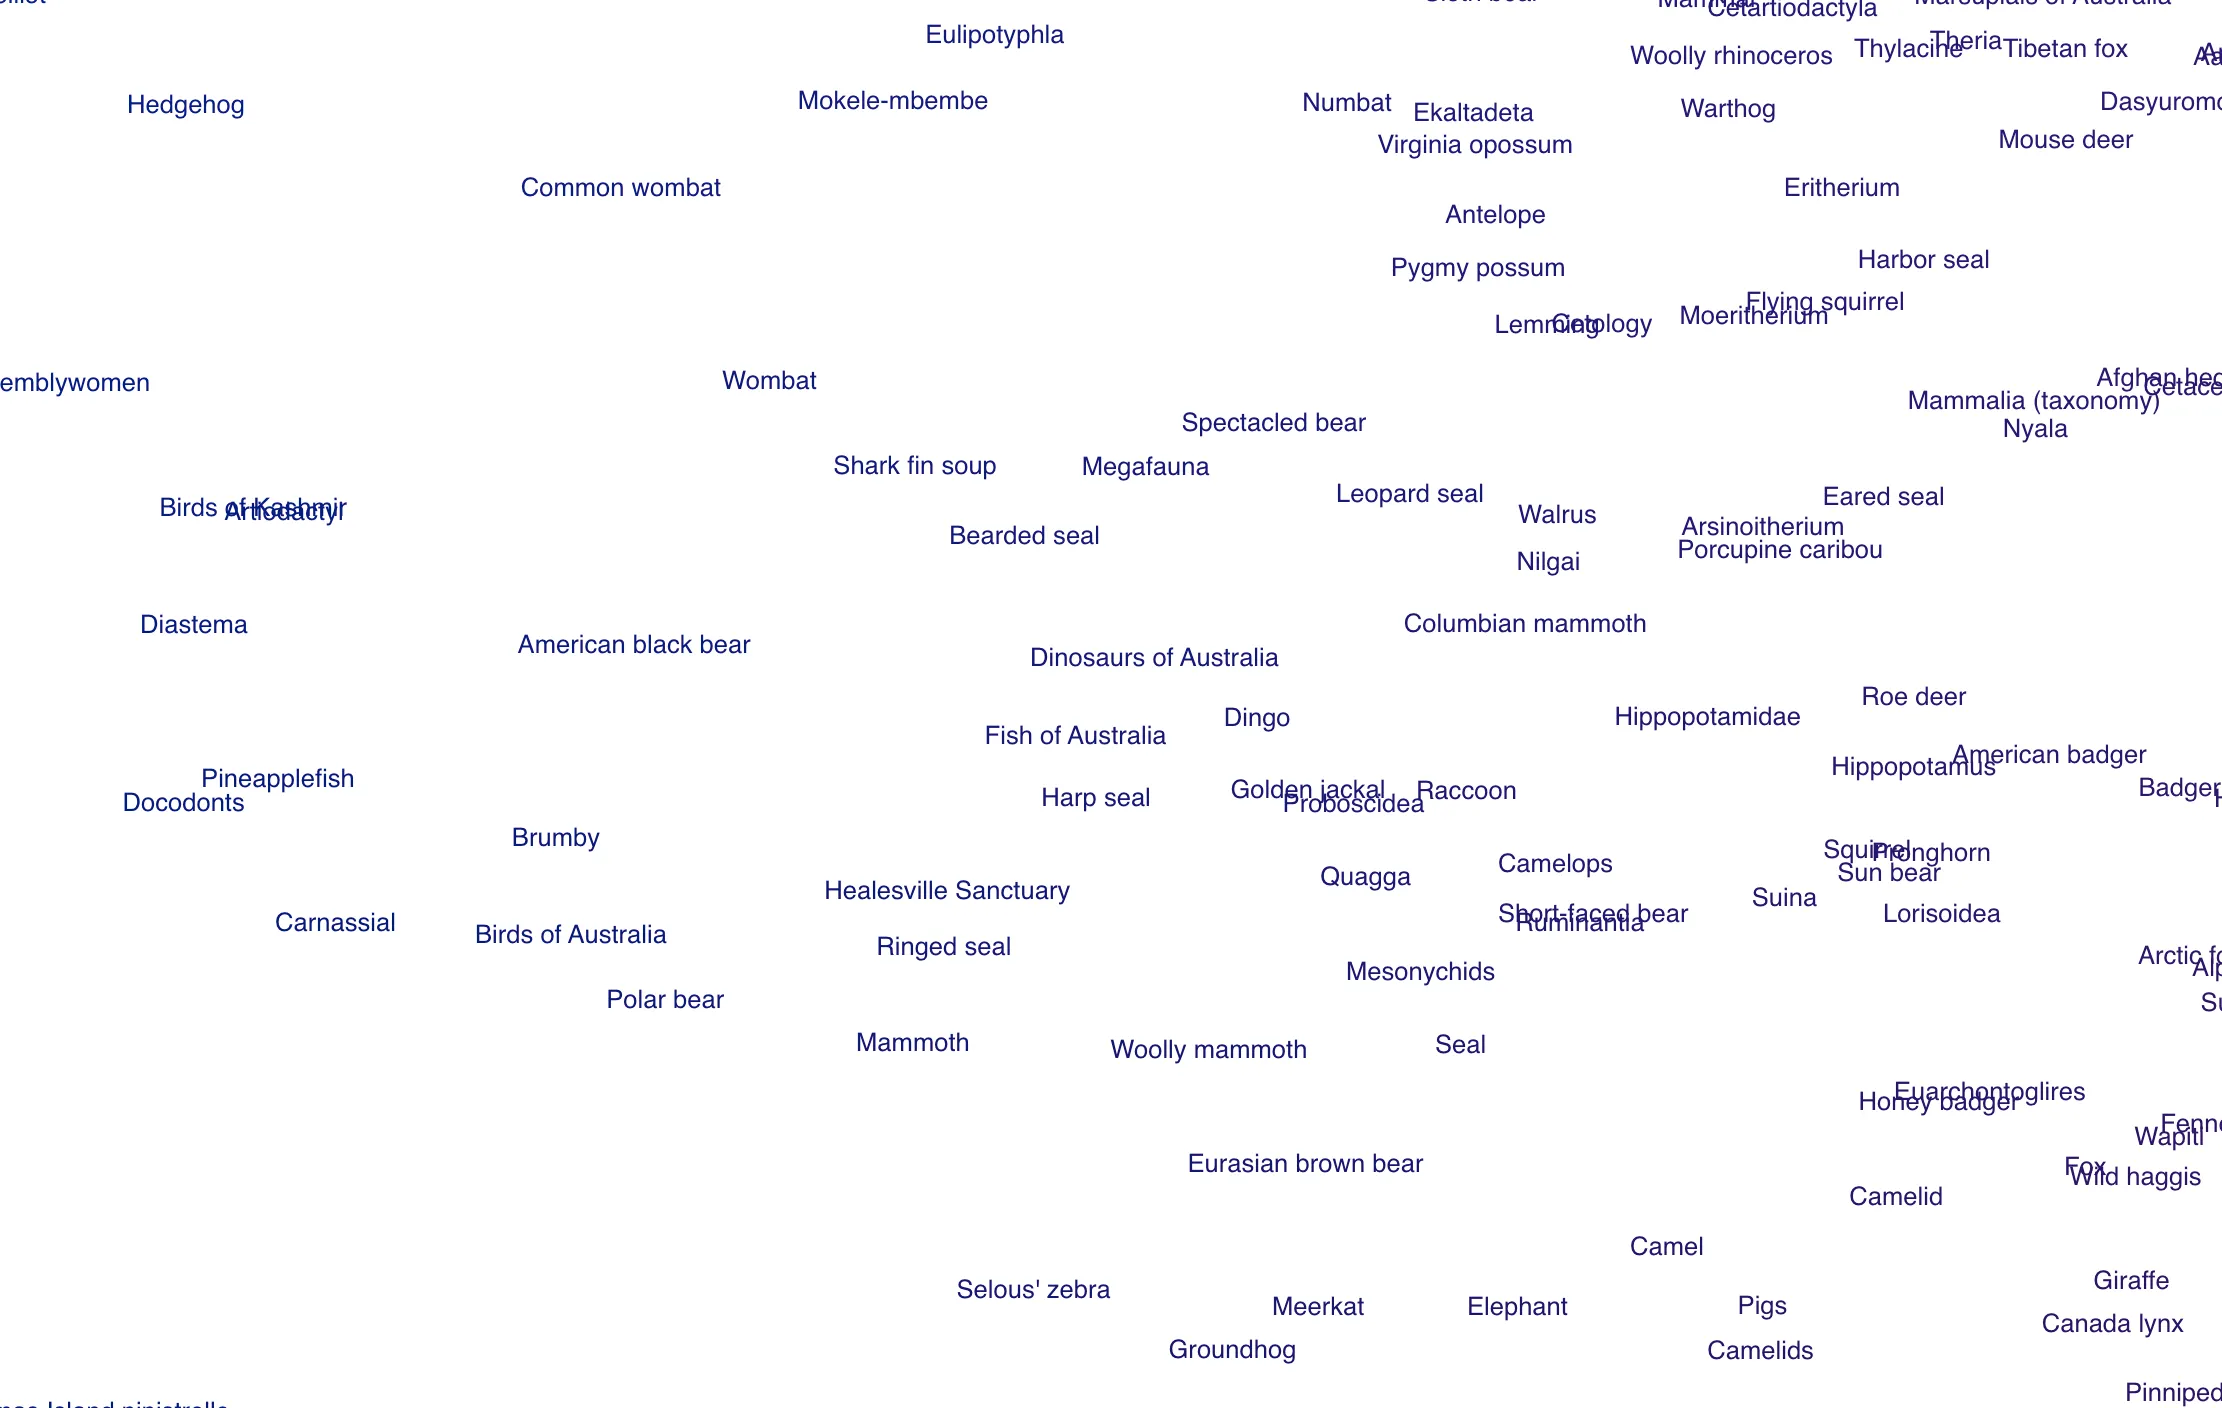
Zoomed in
We can see articles about animals are grouped.
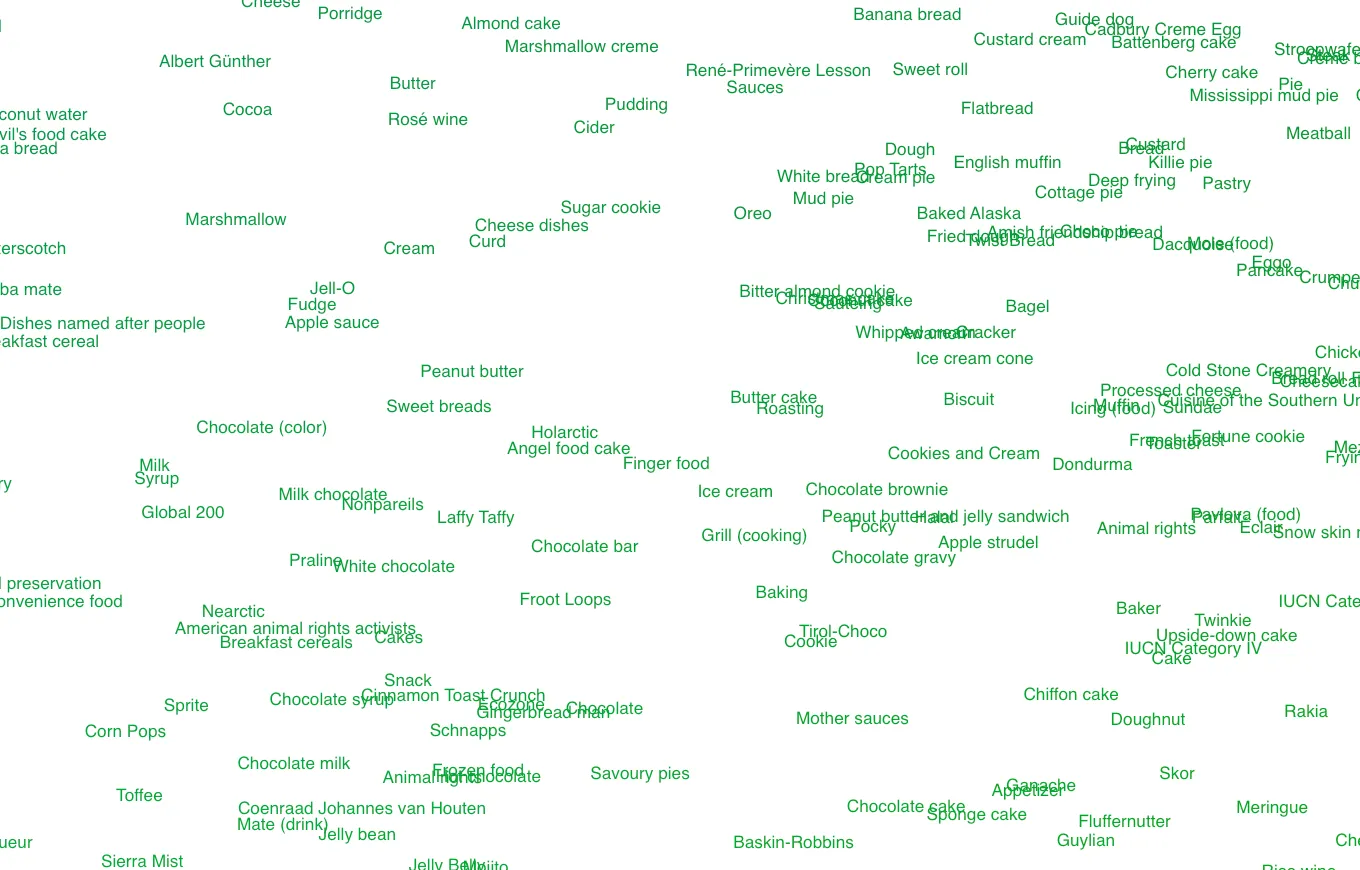
Similarly, articles about food and ingredients are grouped.
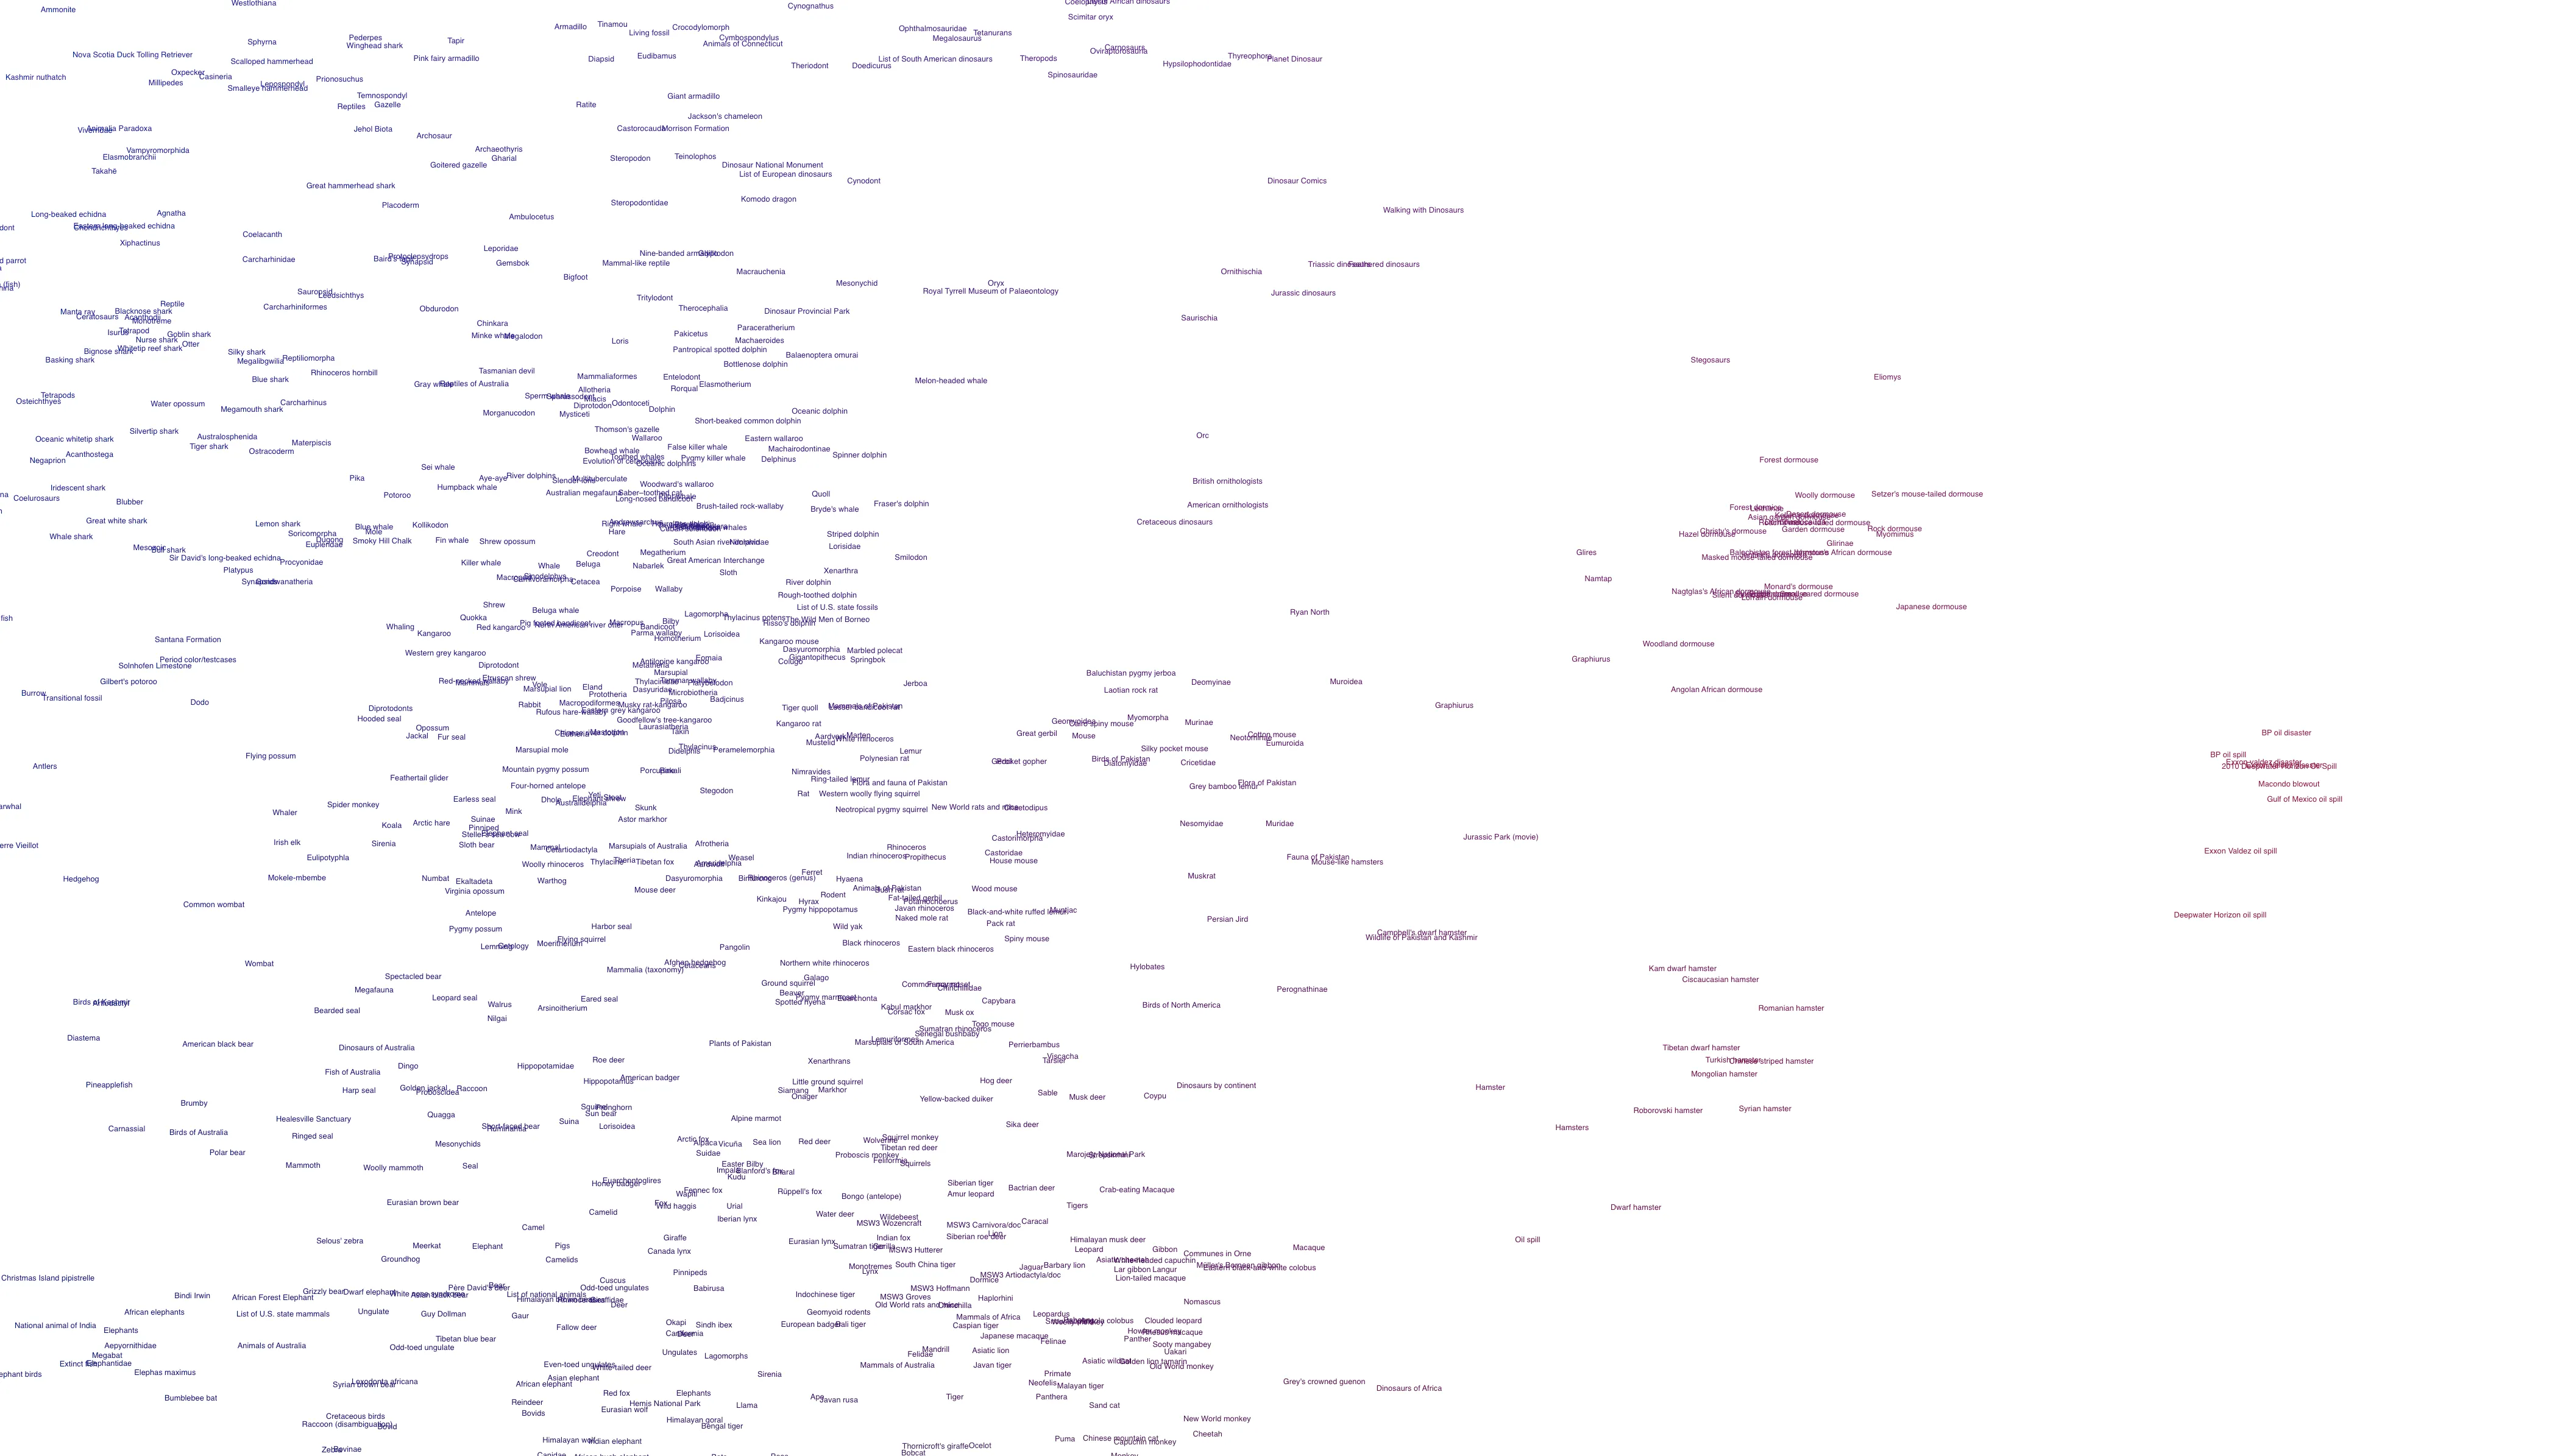
Zoomed out 2D Plot
The visualization creates a huge 2d map of Wikipedia articles, and you can see clusters.
3D Space
Now, let’s try 3D space. We set n_components to 3 in UMAP to generate 3D points from the embeddings.
This view shows the articles in 3D.
I added some additional features, such as rotating the text to face the camera, adding color based on location to show groupings, and rending distant nodes as a point.
You can pan, rotate, and zoom around to explore the articles.
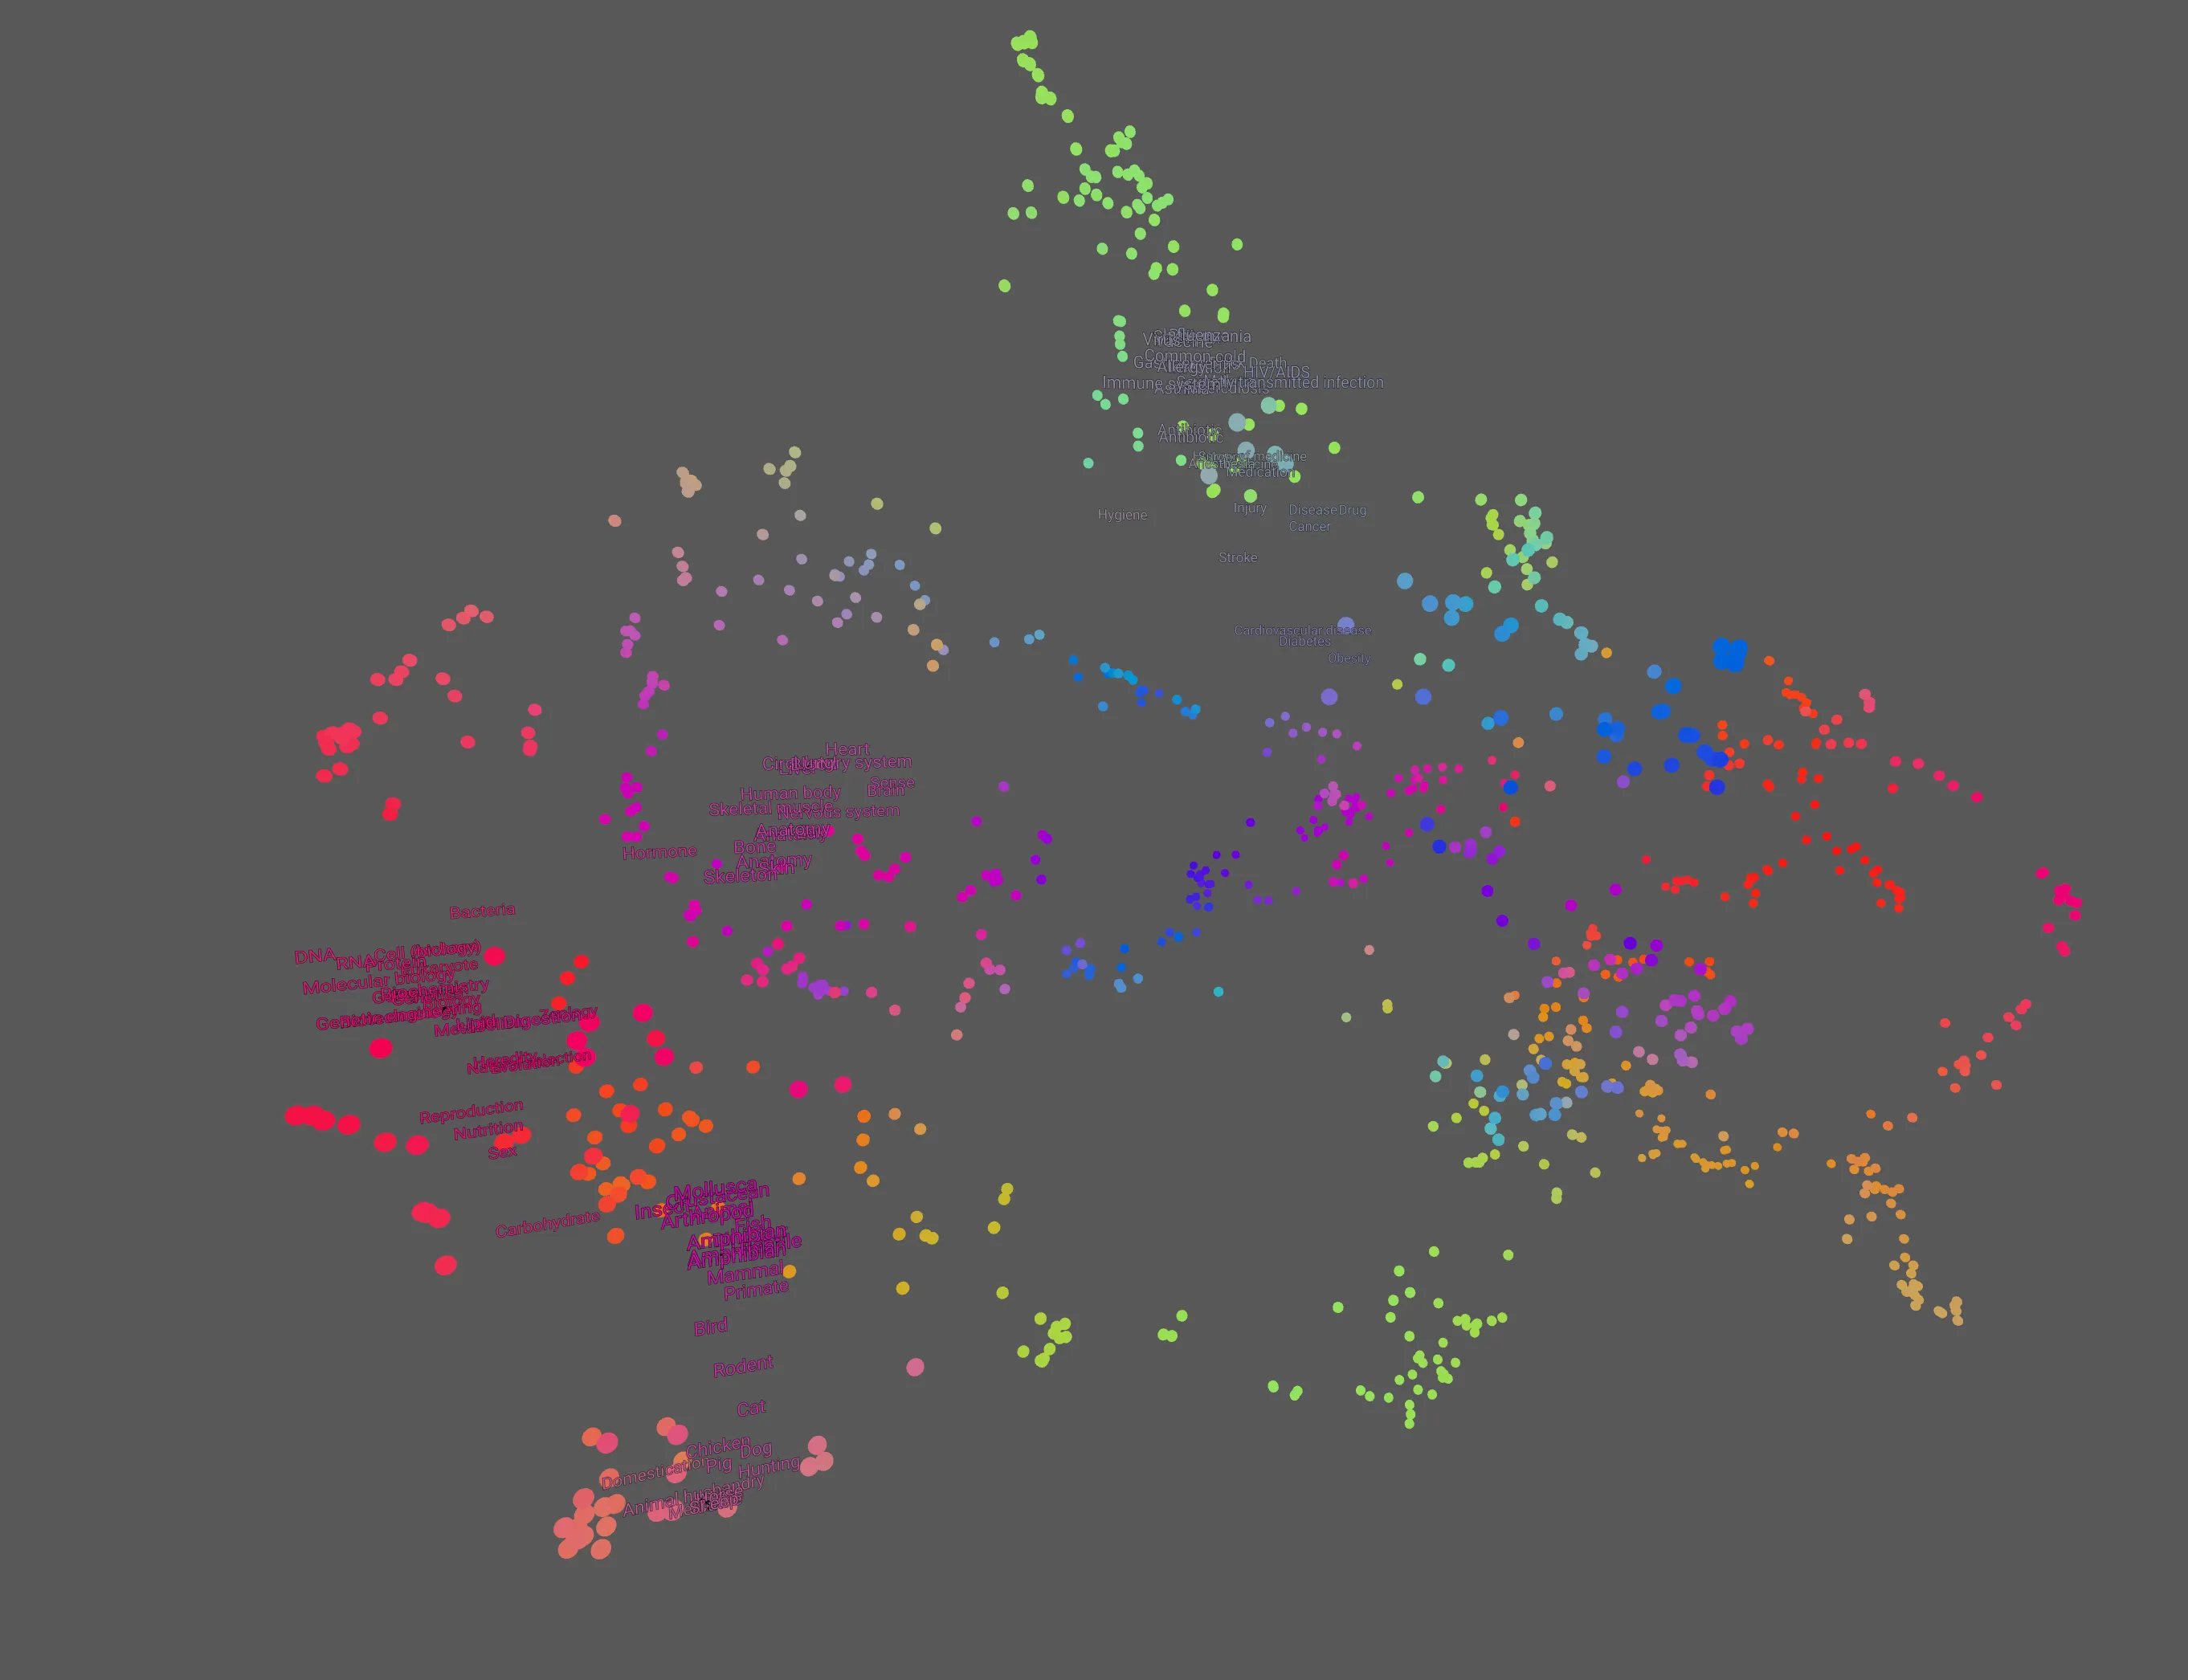
We can zoom in to see groupings and that similar articles are grouped.
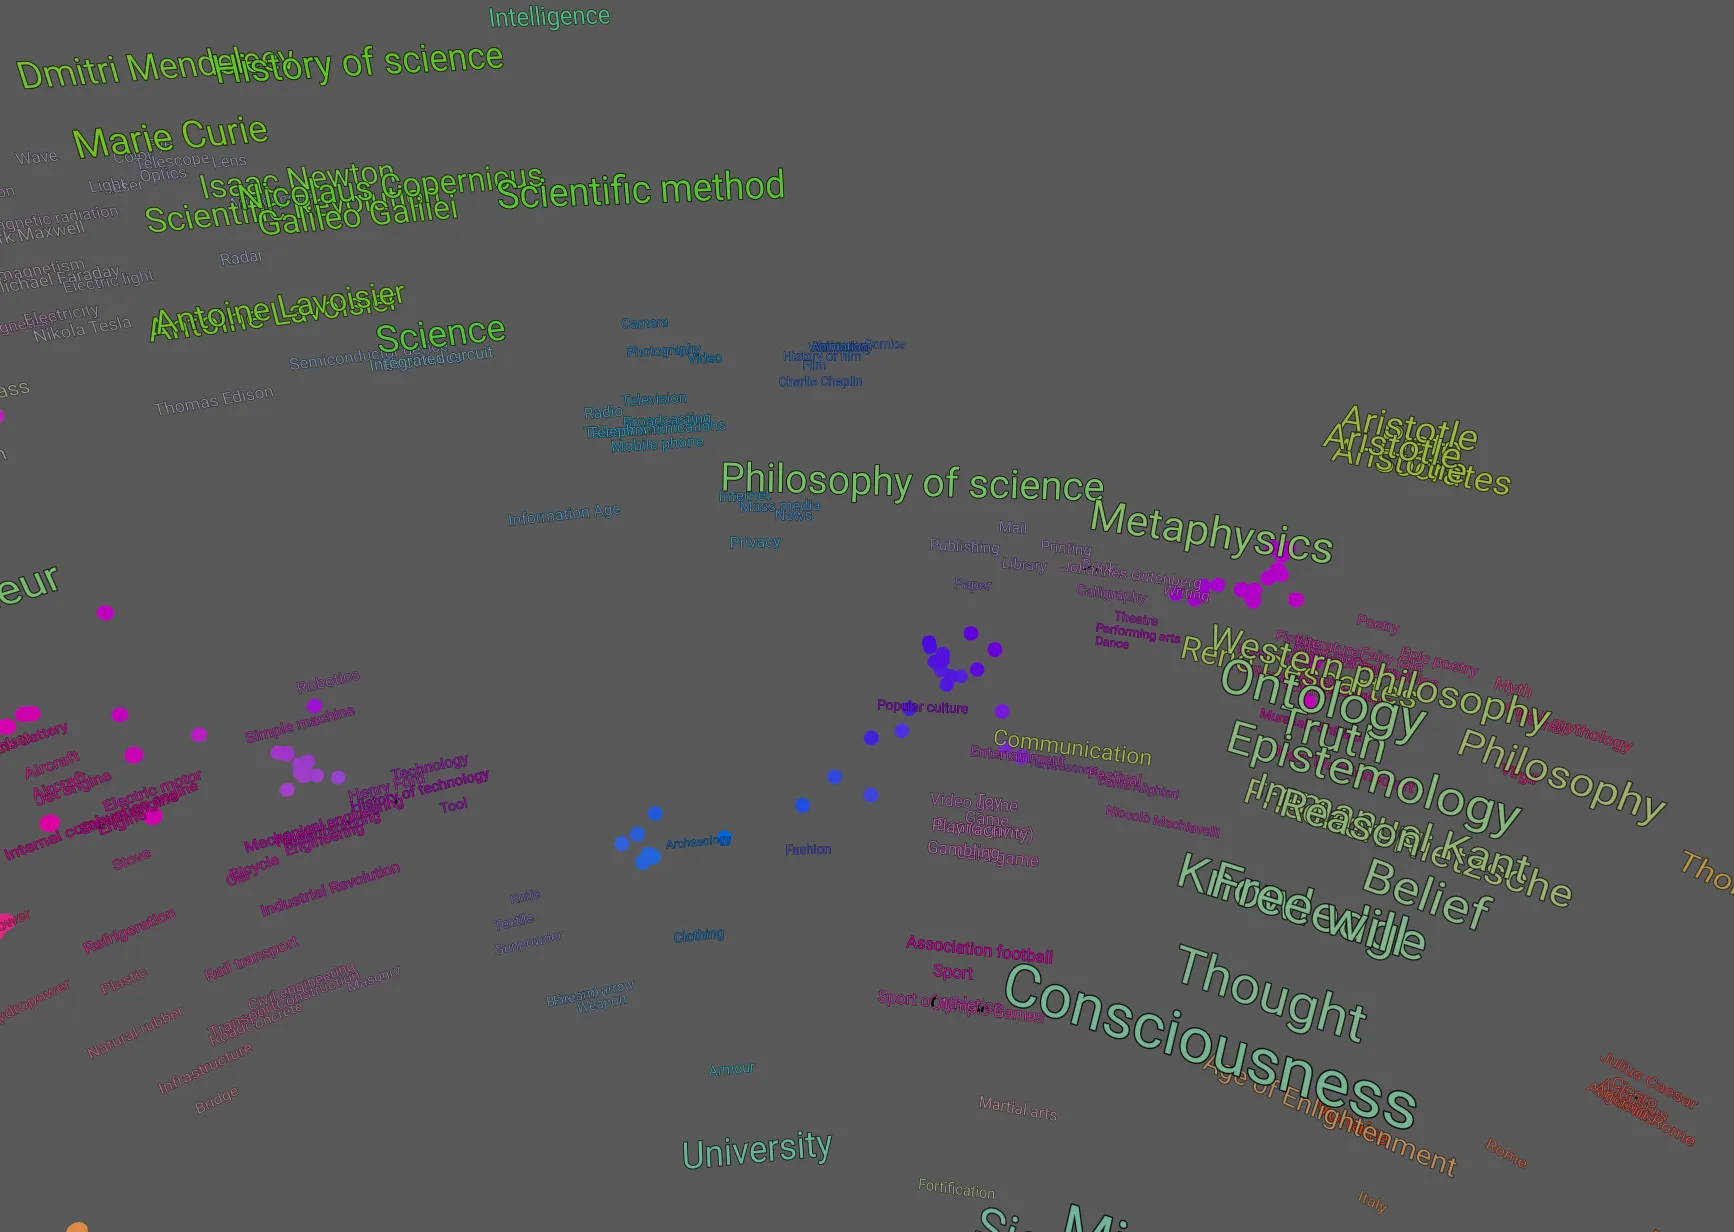
The 3D space allows for more fluid categorizations, enabling articles to exist “between groups.” For example, the “Philosophy of Science” article is placed between a cluster of articles on science and a cluster of articles on philosophy.
Subjectively, the groupings seem better and make more sense for the 3D view than 2D. Turning the embeddings into 3D points, rather than 2D preserves much more information about their relationships and creates better groupings
Here’s what the 10k article graph looks like:
Implications and Uses
Dynamic Categorization
Organizing based on text embeddings allows for a dynamic, fluid way to categorize notes or articles. Unlike rigid folder structures, this method enables an article to belong to multiple overlapping or between categories.
As new articles are added, all articles shift and reorganize themselves around the new articles, so no manual organization is necessary. It’s automatically organized based on the meaning of the content.
Discovery and Exploration
The 3D environment encourages users to explore information in a more engaging way, potentially leading to unexpected yet relevant findings.
Since the associations and groupings are suggested by the machine and not formed manually, you’re more likely to discover unexpected links and connections between information.
Semantic Search
Text embeddings are also used to implement “Semantic Search,” which allows you to search for documents based on similarity instead of keywords.
The 3D gives us an intuitive understanding of how search works; we could imagine the search term in 3D space, and the search results would be the closest articles to the search query.
Real-world Application
The primary focus of this experiment is Wikipedia. However, this method can extend to personal or corporate knowledge bases. It’s a unique alternative for exploring and discovering information.
With the potential rise in popularity of devices such as Apple Vision, the importance of crafting 3D interfaces could surge significantly.
Example Python code
It’s straightforward to generate text embeddings and compare their similarity using Python. Here are some simplified examples so you can understand how the code works.
Using the all-MiniLM-L6-v2 model, you can give it text up to ~500 words long, and it will generate a text embedding, an array of 384 floating point numbers.
Generate a text embedding
from sentence_transformers import SentenceTransformer
model = SentenceTransformer('all-MiniLM-L6-v2')

text_to_embed="The quick brown fox jumped over the lazy dog."
embedding = model.encode(subdocs_contents)
print(embeddings)
## [ 4.63508442e-02  9.21483636e-02  4.07040417e-02, ...]
Compare similarity
Comparing text with high similarity
from sentence_transformers.util import cos_sim

similar_text = "The slow brown fox jumped over the lazy cat."
similar_embedding = model.encode(similar_text)
similar_score = cos_sim(embedding, similar_embedding)
print(similar_score)
## .9036 similarity. very similar
Comparing text with low similarity
not_similar_text="Text embeddings help computers understand text better."
not_similar_embedding = model.encode(not_similar_text)
not_similar_score = cos_sim(embedding, not_similar_embedding)
print(not_similar)
## 0.0428 similary, not similar at all
Turn embeddings into 2D or 3D points with UMAP
from umap import UMAP

## n_components=3 gives us 3D points, =2 gives 2D points
xyz_points = UMAP(n_components=3).fit_transform(all_embeddings)
print(xyz_points)
## returns array of (x y z) coordinates, a 3d point for each piece of text
## [[0.3434,0.543, 0.0083],...]
Conclusion
The experiment shows the potential of combining text embeddings with 3D interfaces for information management. It not only simplifies the organization but also enriches the exploration experience.
As we continue to generate and consume more information, self-organizing approaches will be key to managing this ever-growing digital world.
